
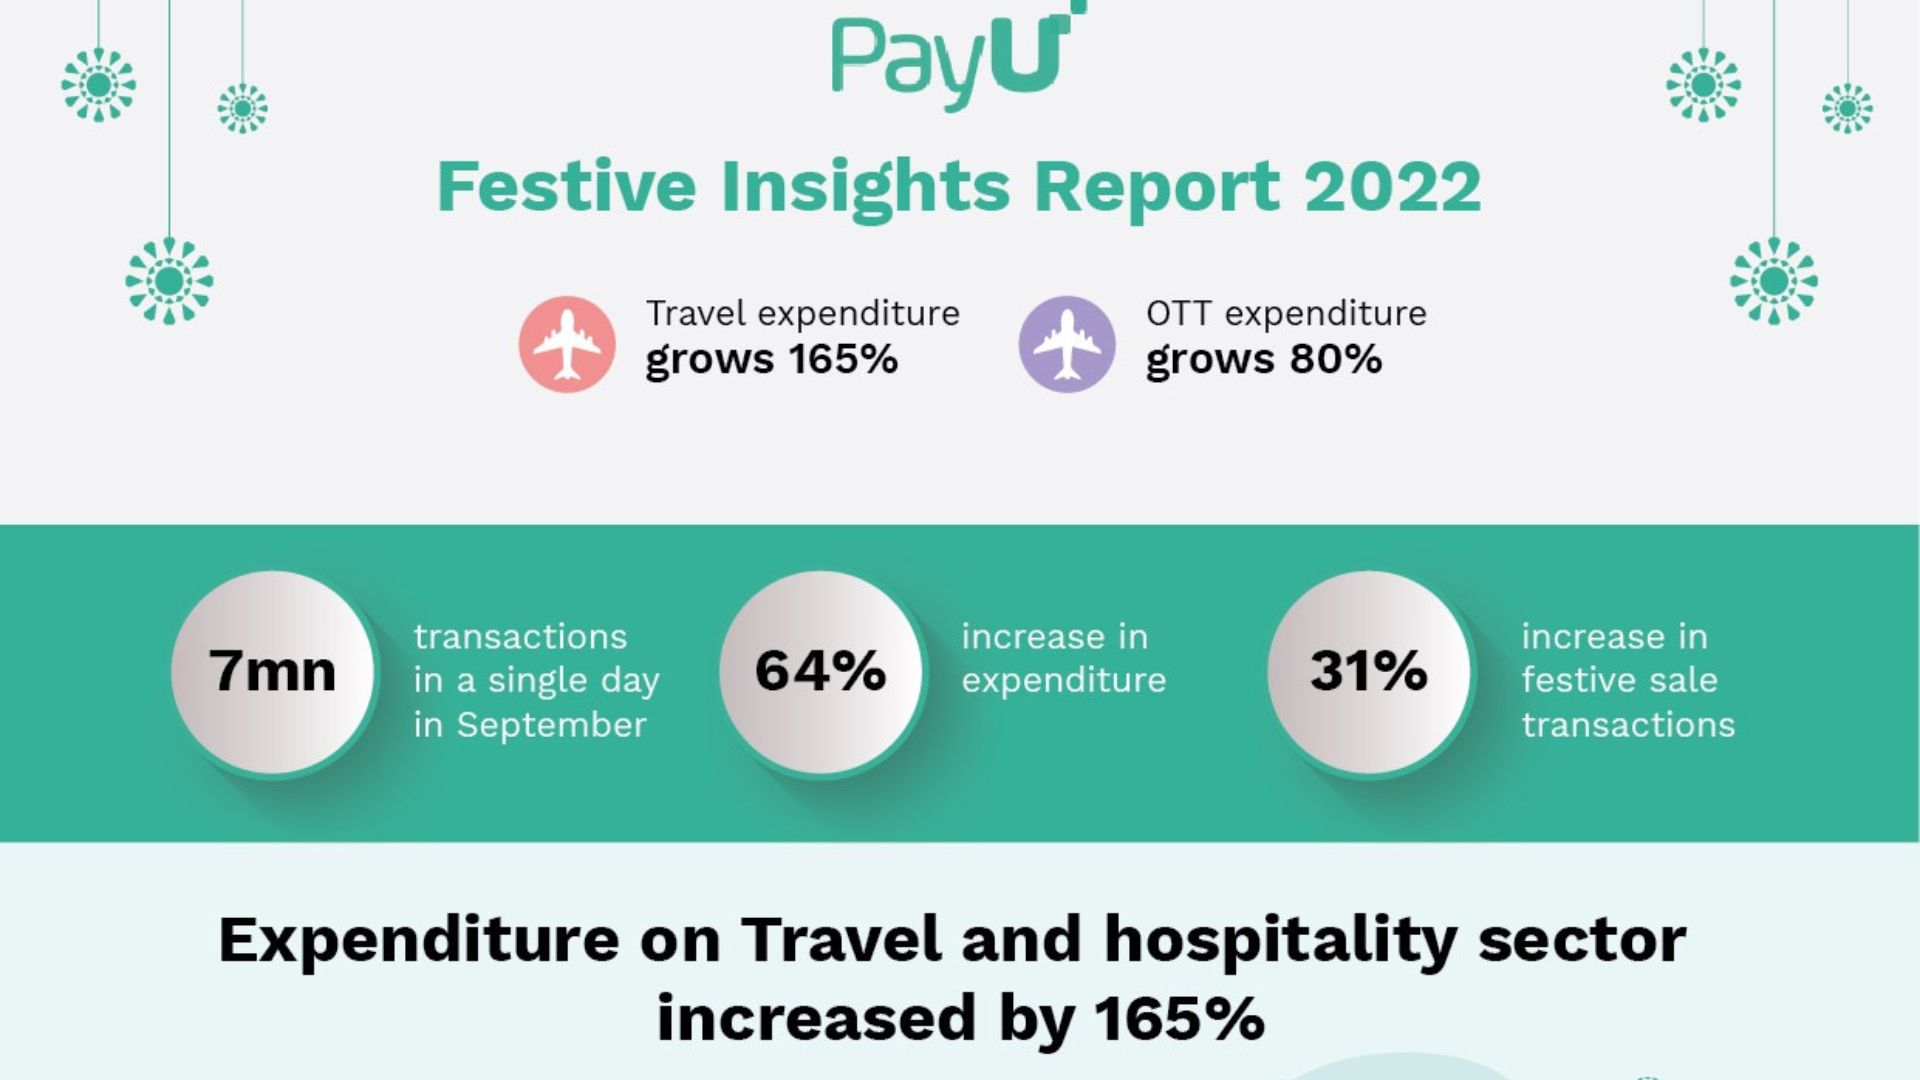
Close to 7mn transactions processed in one day as major brands announce sales on same day credit Repayment via UPI mode sees 251% growth in expenditure and 172% growth in transactions
PayU unveiled its Insights Report – Festive edition today, which compares digital payment transaction trends on the PayU platform between the festive seasons of 2021 and 2022*.
2022 saw a 64% increase in expenditure & 31% increase in the number of transactions vis-à-vis festive sale period in 2021.
There has been a 245% increase in price & 130% increase in the number of transactions between the ‘normal’ period of 2019 & post-pandemic period of 2022.
Moreover, the report also mapped the overall pandemic impact on Indians’ adoption of digital payments for the festive period.
Critical insights for 2022 vis-a-vis 2021
India’s strong credit preference
Credit cards were the most preferred mode of payment this season. Interestingly, credit card users spent about five times more than debit card users in 2022 (total expenditure), even though there is one credit card for every 12 debit cards.
On average, a credit card user spent Rs. 6000 compared to a debit card user who spent Rs. 2500 in 2022. Year on year, credit card transactions and expenditures grew 42% and 84%, respectively. One reason could be banks offering cashback, reward points, discounts, deals & add-on services on cobranded cards & standalone cards.
The appetite for credit is also reflected in the fact that credit repayment (i.e., personal loans for consumers & businesses) saw a 107% increase in expenditure & 105% increase in transactions over the last festive season.
One of the highest categories for UPI spending was Credit Repayment, showing that Indians are increasingly repaying personal loans using UPI. Not surprisingly, debit card transactions declined by 34 %.
Revenge tourism is the rage.
Not only are Indians traveling extensively, but they are using all modes of travel. Whether motivated by revenge tourism or the extended Diwali weekend, Indians’ expenditure in the travel and hospitality sector showed a 165% increase this festive season. Cabs showed a 121% increase in price, while train bookings witnessed a 50% increase in expenditure & 33% increase in average ticket size. Airlines saw a 95% increase in average ticket size. Holiday packages saw a 70% increase in price & 341% increase in average ticket size.
UPI driving digital payments adoption for daily use-cases
There was a 133% rise in the number of transactions and a 124% growth in expenditure compared to 2021, probably echoing economic recovery and increased UPI adoption by small businesses & consumers. Interestingly, the average ticket size for UPI transactions has gone down marginally (-4%). Consumers used UPI for small ticket items such as groceries within city travel & entertainment, which could be why ticket size declined. The top 5 cities contributing to the highest number of transactions through UPI are Mumbai, Bangalore, Hyderabad, Chennai, and Delhi NCR.
Digitization and economic expansion led to the growth of financial services.
In the Banking and Insurance sector, transactions & expenditures increased by 100% and 143%, respectively. This general sentiment is reflected across BFSI categories; total spending in the insurance space grew by 41%, perhaps driven by economic expansion, regulatory moves, and increasing insurance penetration. Investments saw a 66% growth in expenditure & 50% growth in average ticket size – one possible reason could be the increased adoption of do-it-yourself wealth management platforms – especially among millennials & post-pandemic behavioral changes.
OTT & gaming leading digital entertainment adoption
The entertainment industry witnessed an increase in both expenditure and transactions of 52% and 54%. OTT expenditure has grown by 80% & transactions by 175%; gaming expenditure shot up by 20%. However, expenses related to watching movies physically and attending on-ground events witnessed a decline in spending and transactions of 11% and 43%, respectively – perhaps habits set during the pandemic (OTT preference & avoiding public spaces) continue post-pandemic.
“PayU is a pioneer in driving value addition for merchants and banks through data insights, offering targeted solutions which allow them to deepen customer engagement & create actionable business strategies. Based on these insights, we can determine economic & industry-specific trends and whether these reflect broader market movements. We see that behaviors formed during the pandemic persist into the new normal with the preference for travel, digital entertainment & UPI increasing significantly this festive season.”
Commenting on the PayU Insights Report – Festive Edition, Paulami Das, Director, PayU Payments, said,


